
603-521-5910
CUSTOM VBS3 AND VBS4 BENCHMARK TOOL
Role: Product Owner and Programmer
Development Time Frame: April 2019 - May 2019
Platform: VBS3 and VBS4
Language: SQF
Achievements: Made a benchmarking tool so that computers could quickly and accurately calculate the limits of their performance in VBS3 and VBS4.
To see how the benchmark tool works, scroll down for the step by step instructions.

Step One
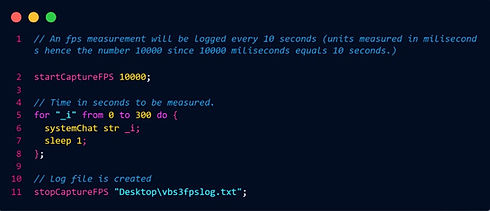
In order to initialize the benchmarking and data collection, the code in the image to the left of this text must be placed in the initialization file of the VBS scenario that is being tested. It is preferred if it is placed at the beginning as that will ensure the smallest chance for errors to arise.

Step Two
After starting the benchmark scenario, or after implementing the benchmark initialization file on any scenario to benchmark, the program will output a sample like the following divided up into four columns. Each line of numbers represents an interval of 10 seconds. The four columns of data from left to right are:
1. The frame number that the benchmark stopped on to gather data. (Note: The benchmark doesn't stop running but this number simply functions as a unique timestamp in the data so that the data doesn't become unordered.)
2. This number is simply the tick time (measured in seconds) that is returned and represents the amount of time passed since VBS as a program was started.
3. This number represents the framerate at the tick time that the system was operating at.
4. This number represents the minimum number of frames per seconds that the system was operating at by calculating the minimum framerate from the last 16 frames of the benchmark.
Step Three
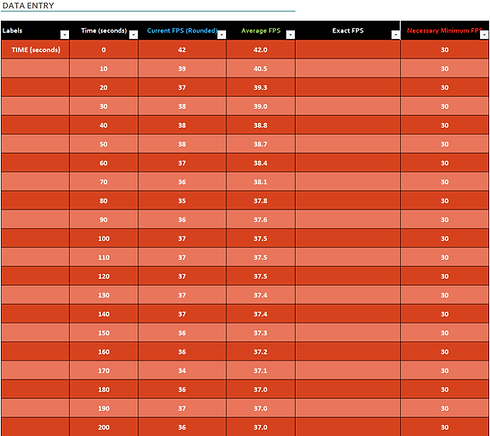
After importing the text file into Excel, you'll see a table similar to the one on the left or you can manually input the data and create your own table with your own labels.
This table represents the time passed since the benchmark has started, the current FPS rounded to the nearest whole number, and the average FPS as calculated by taking all of the previous Current FPS entries, adding them up, and dividing by the number of entries.
The Exact FPS column is left blank since it would just be a duplication of the data left in the Current FPS column.
The final column representing the Necessary Minimum FPS was used as a reference point for our videography team who required us to maintain over 30 frames per second for stable filming.

Step Four
And now for the final step! After creating the data table to store all of the frame data, now the data can be imported the data into an Excel graph.
In the graph to the left, the red line represents the minimum number of FPS needed to maintain stable filming in VBS3. The green line represents the average frames per second rate. And the blue line represents the current frames per second at the time of the benchmark.
The X axis of the graph represents the amount of seconds that have passed during the benchmark. And the Y axis of the graph represents the amount of frames per second.